A guide to using browser extension design research techniques for UI/UX competitive analysis, covering which extensions work best, what data they surface, and how professional designers build competitive intelligence from them.
TLDR: Browser extensions make competitive design research faster by surfacing CSS properties, color palettes, typography, and interaction patterns without opening DevTools. The strongest workflow combines an inspection extension (WhatFont, ColorZilla) with a capture-and-organize extension (InspoAI) to build a structured competitive library rather than a folder of screenshots.
Table of Contents
- Why browser extensions are essential for design competitive research
- What design data can a browser extension actually surface?
- Which browser extensions do professional designers use for research?
- How do you use extensions to reverse-engineer a competitor's design system?
- What are the limits of browser extension design research?
- How do you combine multiple extensions into a research workflow?
- How do you document and share competitive research findings?
- Conclusion
Introduction
Competitive design research used to mean opening DevTools, manually copying hex codes, measuring spacing with pixel rulers, and screenshotting every state of every component. A senior designer doing thorough competitive analysis on five competitor products could spend a full day just collecting data before analysis even began.
Browser extensions changed that math. A set of three or four well-chosen extensions reduces the data collection phase for a competitive site from 45 minutes to 10. The information is the same, but the friction is dramatically lower. This guide covers which extensions work, what data they actually surface, and how to structure a research workflow around them.
Why browser extensions are essential for design competitive research?
Design competitive research has two components: visual analysis (what does the product look like) and structural analysis (how is it built). Visual analysis from screenshots only gets you halfway. Understanding why a UI pattern works requires knowing the underlying design decisions: the type scale, the spacing system, the color hierarchy.
Browser extensions provide structural analysis without requiring DevTools proficiency. A designer who does not know CSS can still use WhatFont to identify a competitor's type stack, ColorZilla to extract the exact hex values from their buttons, and Dimensions to measure their card padding. This democratizes competitive research beyond senior engineers who are comfortable in DevTools.
For teams, the standardization benefit is significant. When every designer on a team uses the same set of extensions for research, the competitive intelligence output is consistent. Everyone captures the same data points in the same format. Source: UX Planet
Extensions also enable research at browsing speed. You visit a competitor's product, your extensions passively surface information about what you're looking at, you capture what's relevant, and you move on. No mode-switching between browser and DevTools, no manual measurement.
What design data can a browser extension actually surface?
A well-equipped browser extension toolkit can surface:
Typography: Font family, font weight, font size, line height, letter spacing for any text element. Extensions like WhatFont and Font Ninja extract this data on hover.
Color palette: Exact hex, RGB, and HSL values for any pixel on the page. ColorZilla and Site Palette give you full palette extraction from the rendered page.
Spacing and sizing: Pixel dimensions of any element, padding values, margin values, and component dimensions. Dimensions and Page Ruler Redux handle this.
Grid structure: Column count, gutter width, and layout breakpoints. Extensions like Grid Ruler and Gridman overlay the detected grid onto the page.
CSS properties: Full computed CSS for any selected element. Browser DevTools cover this natively, but extensions like CSS Peeper package the output in a more designer-friendly format.
Technology stack: What frameworks and libraries a product is built with. Wappalyzer identifies front-end frameworks, analytics tools, and CMS platforms.
Accessibility scores: Contrast ratios for any color combination on the page. WCAG Color Contrast Checker surfaces accessibility data while you browse.
Which browser extensions do professional designers use for research?
The core research extension stack used by professional UI/UX designers in 2025:
WhatFont: Identifies fonts on hover with full type specimen data. Essential for typography research. Free.
ColorZilla: Eyedropper and palette extraction for any color on any page. The palette history feature is useful for building competitive color intelligence. Free.
Dimensions: Hover-based dimension measurement for any element. Faster than DevTools for quick measurements. Free.
CSS Peeper: Packages CSS inspection in a visual, designer-friendly panel rather than raw DevTools output. Shows fonts, colors, assets, and box model in a scannable format. Free.
Wappalyzer: Technology stack detection. Useful for understanding whether a competitor's design choices are constrained by their tech stack. Free tier available.
VisBug: Google-built extension for visual debugging and element inspection. More powerful than CSS Peeper for deep CSS analysis. Free.
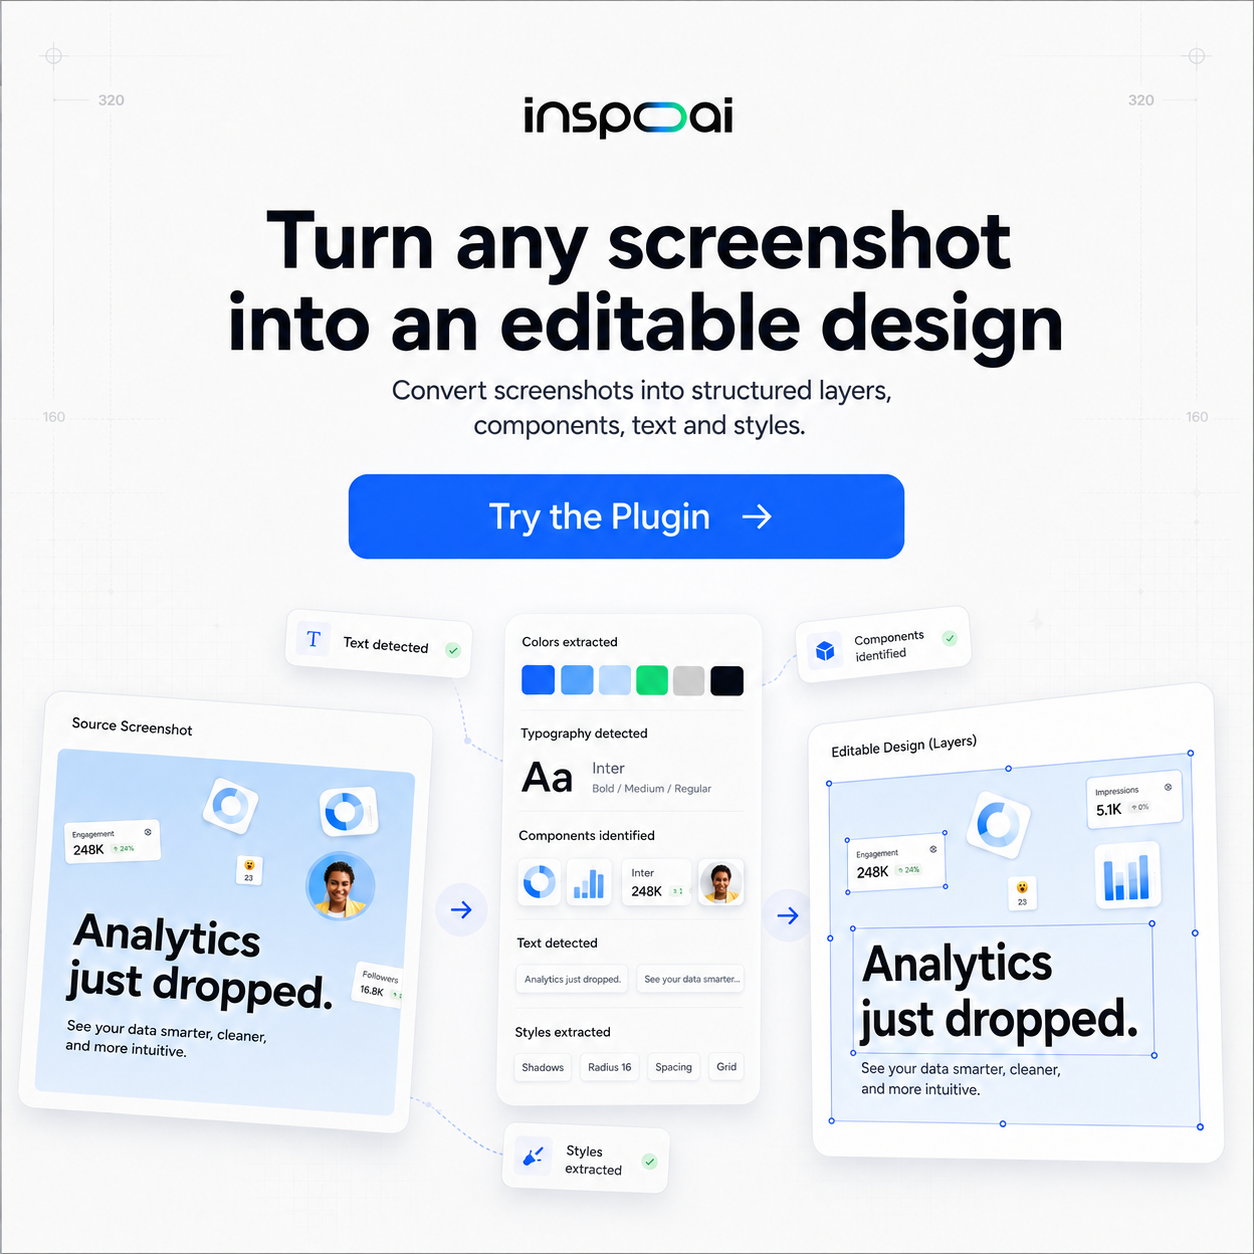
InspoAI Chrome Extension: Captures the full research session into a tagged, searchable library with source metadata. Integrates with the InspoAI platform for moodboard building and Figma export. The connective tissue between the inspection extensions and a usable research output. Source: Awesomic
How do you use extensions to reverse-engineer a competitor's design system?
Reverse-engineering a competitor's design system from their live product follows a five-step process using browser extensions.
Step 1: Extract the color palette. Use Site Palette or ColorZilla to extract every color from the competitor's home page and two or three product pages. Group into primary, secondary, accent, background, and text tiers.
Step 2: Map the type scale. Use WhatFont on headings (H1 through H4), body copy, captions, and navigation labels. Record font family, sizes, weights, and line heights. Most products use 6-8 distinct type styles that define their visual hierarchy.
Step 3: Measure the spacing system. Use Dimensions to measure padding inside buttons, card padding, section spacing, and grid gutters. Most products use a 4px or 8px spacing base unit. Identifying the unit quickly narrows the design system.
Step 4: Document component states. Manually interact with interactive elements (buttons, inputs, dropdowns, hover states) and screenshot each state. Standard inspection extensions do not capture interaction states, so this step is still manual.
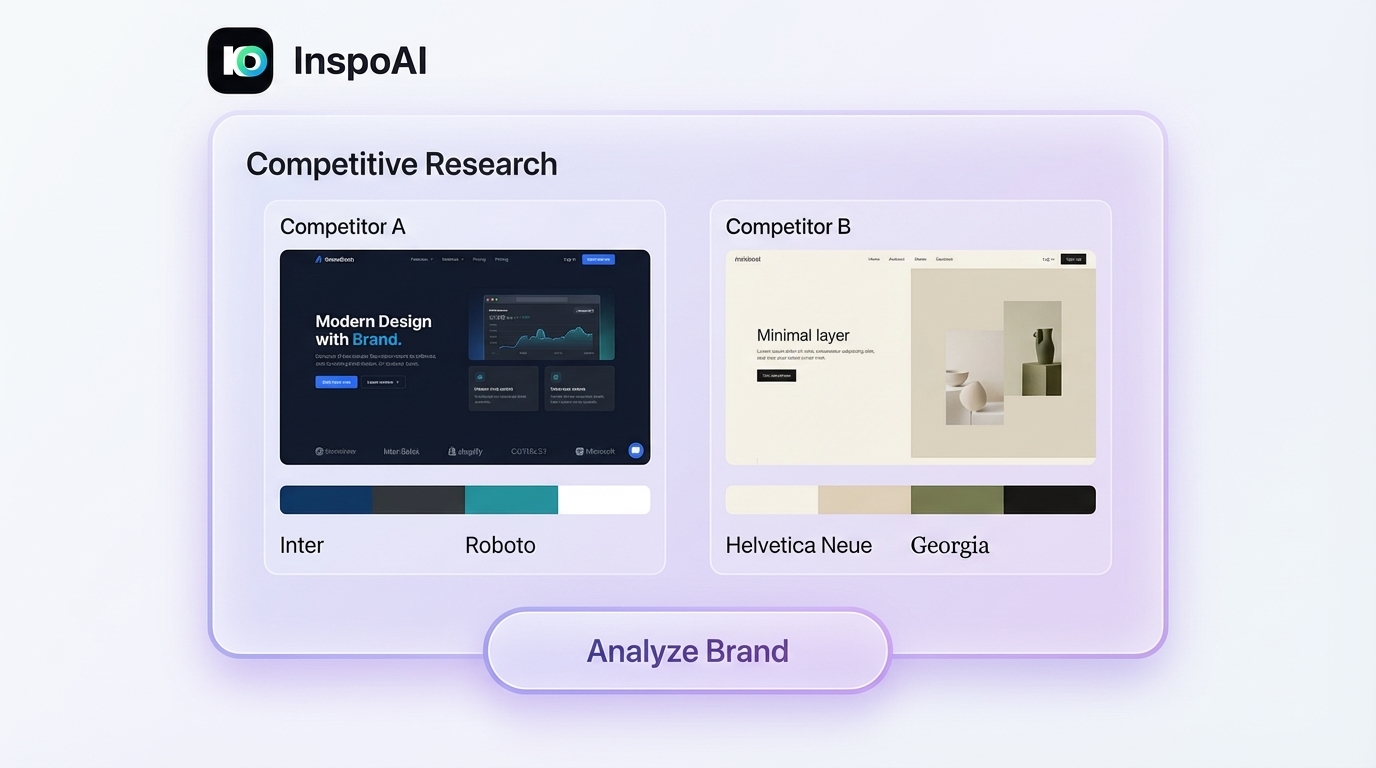
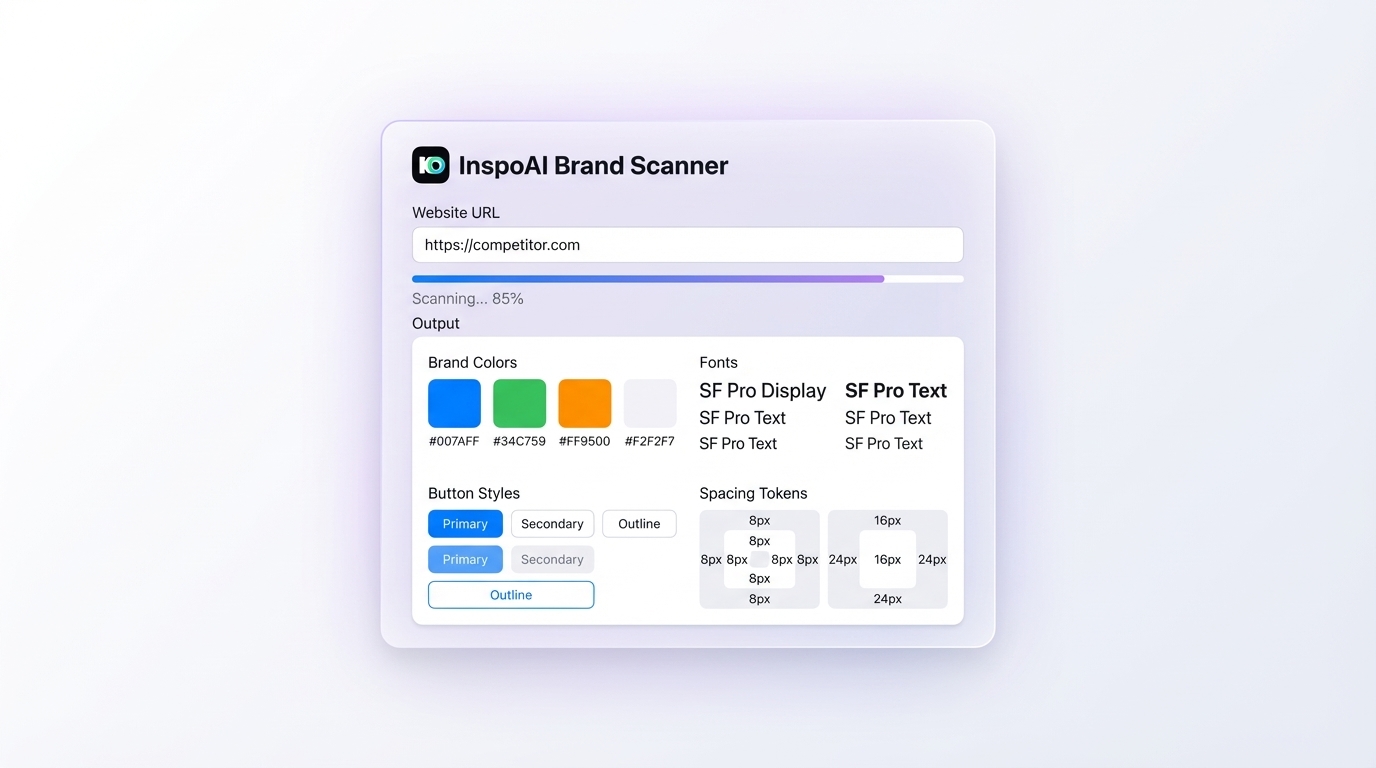
Step 5: Capture and organize. Use InspoAI to capture the key screens with your research notes attached, organizing them into a "Competitor: [Name]" collection. The InspoAI Brand Scanner automates steps 1-3 for any URL, generating a brand report with colors, fonts, and spacing without requiring individual extension lookups.
What are the limits of browser extension design research?
 Brand Scanner">
Browser extensions surface the visible and computed design layer. They cannot access:
Animations and transitions. CSS animations and JavaScript-powered micro-interactions are not surfaced by standard inspection tools. Capturing interaction design requires screen recording.
Responsive behavior documentation. Extensions show you the design at one viewport size. Understanding responsive breakpoints requires manual viewport resizing or a responsive inspection tool.
Private/authenticated views. Competitive research using extensions only works for public-facing product pages. Competitor dashboard features behind authentication walls require actual account access.
Design intent. Extensions tell you what design decisions were made, not why. A 14px button label might be an intentional accessibility choice or a legacy decision never revisited. Extensions give you data; inference requires human analysis.
Version history. Extensions capture the current state. They do not tell you what the design looked like six months ago or how it has evolved. Tools like Wayback Machine complement extension-based research for historical comparison.
Understanding these limits helps set realistic expectations for extension-based competitive research. It is excellent for surface-level design system extraction. It does not replace user research, usability testing, or strategic analysis. Source: o-mega.ai
How do you combine multiple extensions into a research workflow?
A practical combined extension workflow for a 90-minute competitive research session on one competitor:
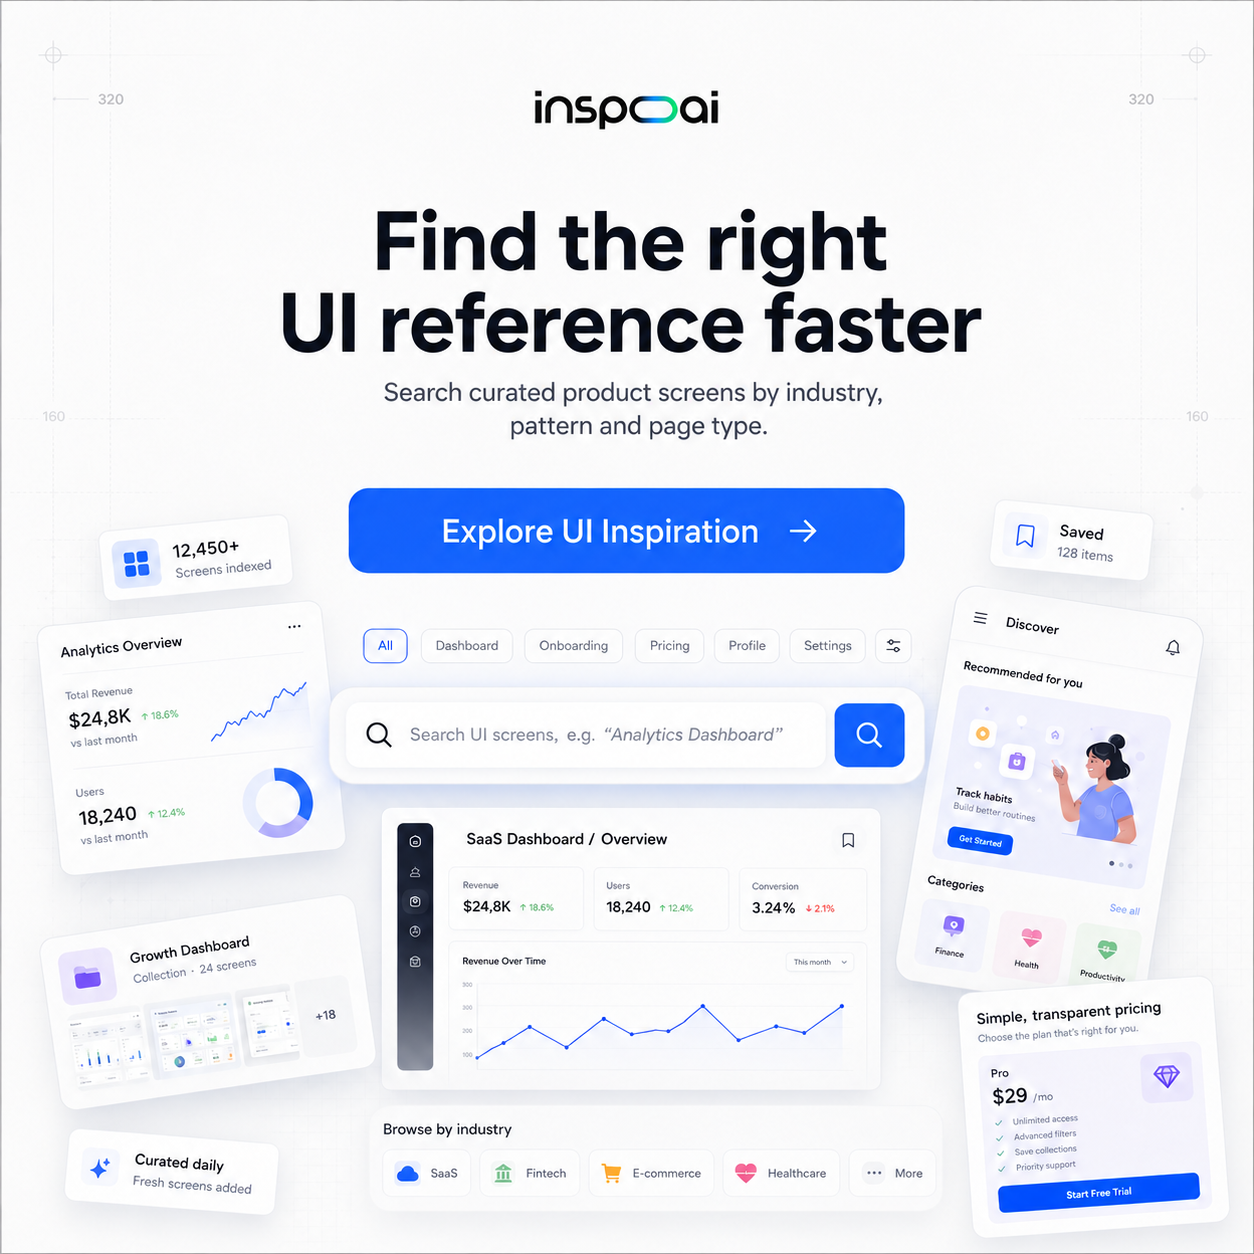
Minutes 1-10: Open the competitor's home page. Run Site Palette to extract the full color palette. Use WhatFont on primary headings and body copy. Record in a shared doc or directly in InspoAI's notes field.
Minutes 10-30: Browse core product pages (pricing, feature pages, dashboard screenshots on marketing site). Use Dimensions to spot-check spacing on card components and button padding. Use CSS Peeper to extract the full style sheet for one representative page.
Minutes 30-60: Interact with all interactive UI elements. Screenshot key states (default, hover, focus, error, success, empty) using InspoAI capture. Tag each capture with the component type and state.
Minutes 60-80: Run InspoAI's Brand Scanner on the competitor's primary URL to generate an automated brand report. Compare the automated output with your manual notes to catch anything you missed.
Minutes 80-90: Organize captures into a named competitive collection in InspoAI. Add a summary note at the collection level with your key observations.
Output: A structured competitive intelligence document with color palette, type scale, spacing system, and component screenshots, ready to share with the team or export to Figma. Source: Top 30 Chrome Extensions for UI/UX Designers
How do you document and share competitive research findings?
Documentation transforms raw competitive data into team-usable intelligence. Three documentation formats work well:
Competitive card: A single-page summary for each competitor with color palette swatches, type specimens, key UI screenshots, and three bullet observations. Quick to produce, easy to share in Slack or email.
Figma competitive landscape frame: All competitor screenshots arranged side-by-side in a shared Figma file. Annotated with extracted design system data. The living reference document for the design team.
InspoAI shared collection: A tagged library that team members can query in real time, rather than a static document that becomes outdated. The advantage over Figma is that the library is searchable by design pattern, not just scrollable.
For client-facing work, competitive cards and Figma frames are more appropriate. For internal team use, a shared InspoAI library stays useful longer because it can be updated as competitor products evolve.
Sharing a competitive research link from InspoAI takes one click. A Figma competitive landscape frame requires manual updates whenever the team captures new competitor data.
Conclusion
Browser extensions reduce the friction of competitive design research from "I need to open DevTools and take 45 minutes per competitor" to "I need 10-15 minutes and a set of three extensions." The data they surface, combined with a capture-and-organize tool for the research output, builds institutional design intelligence that teams can draw on for every project.
Start your competitive research workflow with InspoAI at inspoai.io and add the InspoAI Chrome extension to your browser today.